CALCULATING F-BOMBS
Source of fluoride adequate for two billion
by Julian Bohan
Some people have been
saying for years that fluoridation was primarily devised to dilute and
dispose of industrial waste.
I'm one of them but just how much fluoride was the factory producing when Lincoln City Council (that's Lincoln somewhere in England) voted to put it in the population?
And was it really so much that the fluorocrats would resort to such desperate measures on the back of such a crazy story?
How to deal with this irrationality? What I needed was a SUM. One which could be applied to any area and fluoride source.
Anti-fluoridation campaigners do not want to make wild claims about the amount of fluoride industry produces. Industry and government do not want to discuss the subject at all.
The fluoridation of people who drink tap water would not survive a wider discussion of fluoride pollution. So let's have one.
Though the Council's desperate battle with tooth decay began in the 1960s, ye olde (and full up) 150-acre fluoride waste pond 35 miles northeast of town has yet to be mentioned in the local press.
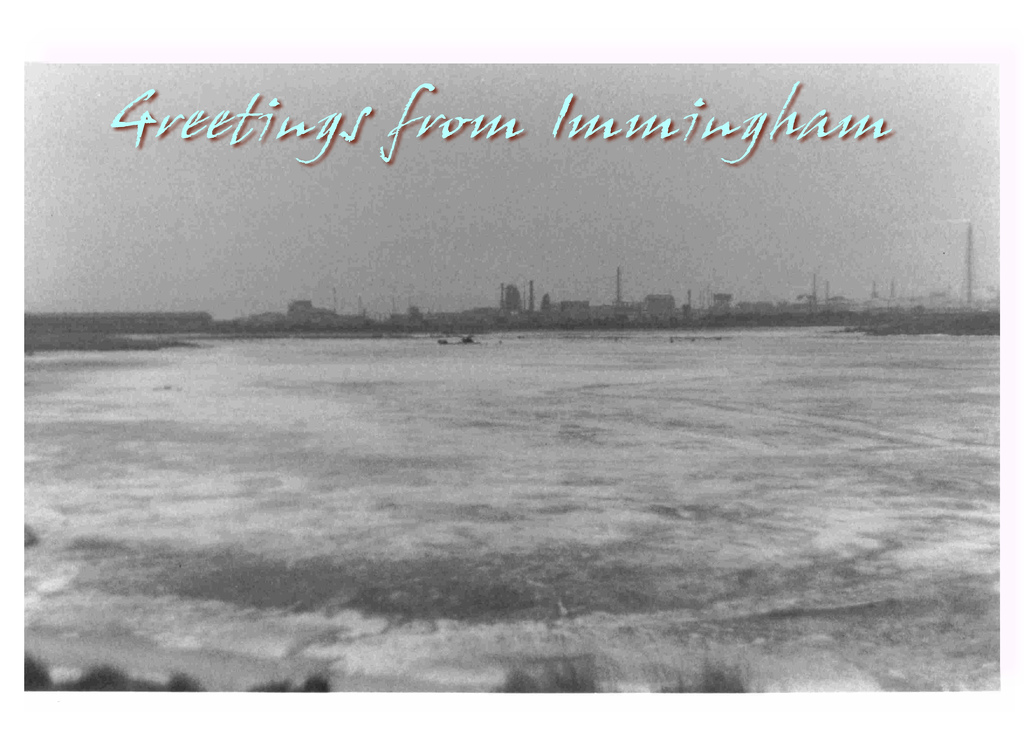
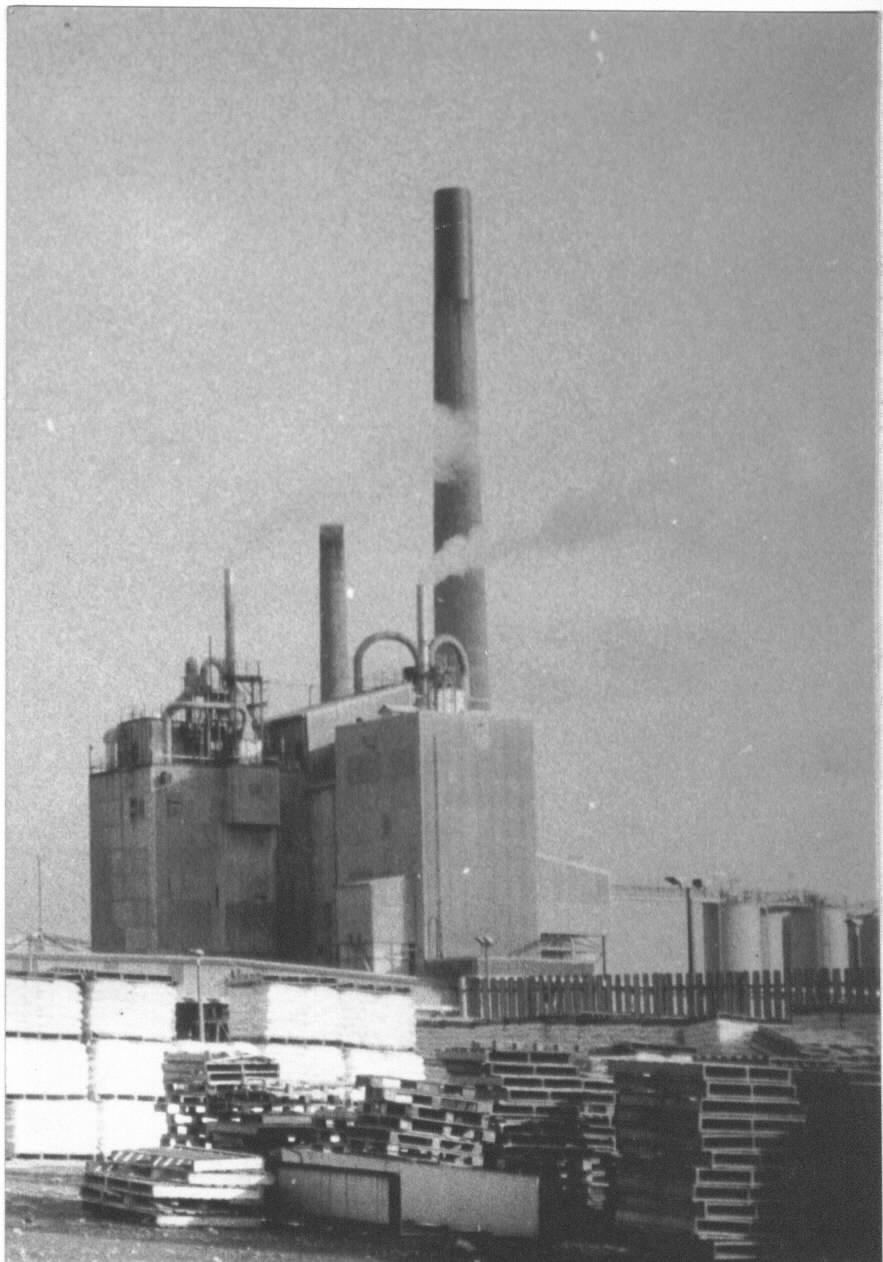
Norsk Hydro Fertilisers Ltd., who took over the Fisons chain in 1982, won’t say what areas its largest factory at Immingham Dock supplies with fluosilicic acid for water fluoridation.
This, of course, makes it impossible to compare the amount of fluoride being produced – which is also a secret – to the amount of water being fluoridated.
So waste dumping claims carry little weight. You can’t tell whether there’s too much fluoride, not enough, or so much that it’s difficult to see what difference fluoridation is going to make to the disposal problem – unless you fluoridate the whole country, rather than just a few backward areas.
Some 1972 data are available on the consumption of raw materials at Immingham. The figures are not up to date, and Norsk Hydro (now Yara Industrial) won’t enlighten us, but it’s clear the factory has grown throughout its lifetime.
The formula I wanted was just this:
Fluoride produced
Fluoride consumed
The product of the formula is F-Bombs. When greater than 1, F-Bombs represents the production overkill, as a multiplicand of requirements.
Conversely, for F-Bombs<1, (1 – F-Bombs) x 100 is the production shortfall in %.
F-Bombs are a unit I have made up, to measure the fluorine supply situation compared to a selected water usage. Because the latter is customisable it is obvious that F-Bombs have no absolute value. They just illustrate a relationship.
Fluoride source, with which the Lincoln Twenty were able to correct the fluorine deficiency in unborn babies, all food, fizzy pop and car washes. Phew! That was lucky.
Eventually I came up with the following formula for F-Bombs.
T x R x 1,000,000
A x B x C1 x C2
where:
T is the phosphate rock, phosphoric acid or other phosphate material input to the plant in tonnes/day
R =
% rate of evolution of abatable volatilised F
100
1,000,000 is the number of grams in a tonne
A is the target area’s water consumption, in thousands of cubic metres per day (tcmd)
B is the average "treatment requirement", i.e. 1 – X where X is the average natural fluoride content of the area in mg/litre
C1 is the volume in litres of the solution, at a given concentration and 0şC, required to fluoridate 1 tcm (thousand cubic metres) of water at a ratio of 1 mg/litre. This is a constant, and equals 15.8 litres.(4)
C2 is the F content of the solution, at the same concentration and temperature, in grams/litre. Also a constant, C2 equals 63.3 grams/litre.(4)
I’ve used the Anglian Water region as the reference area, but of course you can use anything as a baseline once you know its water consumption, A.
An ideal comparison would take production (fluosilicic acid) and consumption (water) figures for the same year. Unfortunately the only production figure is for 1972, which is based on the factory’s consumption in that year of 130,000 tons of phosphate rock. To convert tons to tonnes, multiply by 1.016047. To obtain the daily consumption of phosphate rock, divide by 365. T for 1972 therefore equals 362.
Anglian Water did not exist in 1972, and so there are no water consumption figures for that area and year. I’ve used the earliest figure available, which is for the year 1974/5.(1) The value for A is therefore 938.
The value for R is taken from published data on fluoride air pollution(3). Phosphate rock contains 3.5-4.0% fluoride, and between a quarter and a half(2) or a third and a half (3) of this is volatilised during processing.
I've chosen a value for R of 0.01, which is on the low side.
Most natural waters contain well below a tenth of the "recommended" fluoride concentration of 1.0 mg/litre. The main supply to Lincoln suffered a 40-fold increase above its natural level. B would be 0.975.
Using 0.9 as the value for B therefore gives a low estimate of the amount of fluoride which would be needed to fluoridate the quantity of water A. Now to enter all this into the formula.
362 x 0.01 x 1,000,000
938 x 0.9 x 15.8 x 63.3
= 4.28 F-Bombs
So by this somewhat fuzzy estimate this factory produced enough fluoride (in 1972) to fluoridate the whole of Anglian Water (in 1974/5) 4.28 times.
Are we any wiser? Well, yes. This fuzzy estimate is also a highly conservative one, due not only to the cautious value for B, but for several other reasons.
On the production side, the value R may be greater than 0.01. Real life emissions would be double. That would double the F-Bombs.
Next, the amount and type of other fluoride-emitting raw materials, such as imported phosphoric acid, is not known. Not even for 1972.
On the “requirement” side—the bottom half of the formula—water consumption in 1972 was almost certainly less than 938 tcmd. Water use has risen historically. Water consumption in 1982/3 was 1,048 tcmd. When A goes down, F-Bombs go up.
Anglian Water is a large area with a large water consumption. A much more impressive F-Bomb figure was obtained using former MP for Lincoln Gillian Merron (1997-2010) as the baseline.
Despite the unlikely hypothesis that she was representative of Lincoln's water consumers, her average daily water intake might nevertheless be 2 litres, i.e. 0.000002 tcmd.
Applying this value for A (and the others as shown above) her result is a staggering 1,984,649,123 F-Bombs.
That is to say, Ms Merron could be fluoridated almost TWO BILLION TIMES A DAY with the fertiliser factory's daily output.
Initial post-WW2 production capacity at Immingham of sulphuric acid, which is the main material used to treat phosphate in the production of fertiliser, and hence fluoride, was 250 tons/day.(5)
By 1971, as fluoridation was getting under way in the Lincoln area, the anticipated production of H2S04 was about ˝ million tons a year or about 1375 tons a day, an increase of 550%.(6)
Having loaded the inputs to my formula heavily in favour of the notion that fluoride output from Immingham is just a tiny trickle, my conservative fuzzy estimate has still come out at a whopping 4.28 Anglian Water-sized F-Bombs.
This a sum every fluoridated water user should understand. Calculating the dilution potential for fluoride wastes, by using the public water system and its users as conduits, may be a subject of interest to the consumer, even if the local paper doesn't think so.
Information barriers are impeding accuracy and blocking time trend analysis of F-Bombs. Ongoing growth is a likely scenario for water sales and for fluorine outputs from this plant. I anticipate present output of fluosilicic acid from Immingham will be vastly greater than the amount used in water fluoridation, if data ever become available.
(1) Anglian Water, Annual Report 1982/3, Table 4.
(2) Rose and Marier: Environmental Fluoride 1977. National Research Council Canada, NRCC No. 16081, Ontario, Canada.
(3) Huffstutler and Starnes: Sources and Quantities of Fluorides Evolved from the Manufacture of Fertiliser and Related Products. 3. Air Pollution Control Association, Dec. 1966, Vol. 11 No. 12, pp682-4.
(4) Gabovitch and Ovrutskiya: Fluorine in Stomatology and Hygiene. Translated from the 1969 Russian edition by the National Institute of Dental Research, DHEW Pub. No. (NIH) 78-785 (1977). U.S. Dept. Of Health, Education and Welfare, Bethesda.
(5) Grimsby Evening Telegraph 23 April 1951.
(6) Grimsby Evening Telegraph 26 February 1971.